Contents
“What gets measured, gets managed “ — Peter Drucker
What is AWS X-Ray?
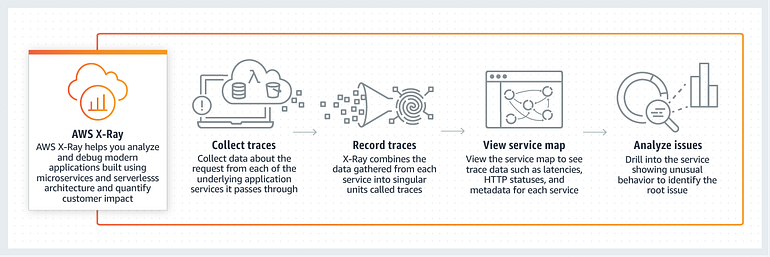
AWS X-Ray is a service that collects data about requests of any underlying application. It also provides tools to view, filter, and gain insights into that data to identify issues and opportunities for optimization.
It provides an end-to-end view of how the application is performing. In a nutshell, X-Ray is an efficient end-to-end instrumentation service hosted by AWS.
Why do we need X-Ray?
Our industry has a few emerging disruptive technologies like big data, cloud computing, bitcoin, microservices, etc. This creates a highly distributed heterogeneous technology stack. There is great need to track what is actually happening within an app in all corners of the system. AWS X-Ray is an ultimate solution to address this business need.

How AWS X-Ray works
X-Ray is different from CloudWatch, because CloudWatch provides logs and metrics for individual applications, whereas X-Ray specifically focuses on tracing between multiple applications.

- X-Ray Daemon : software to listen for traffic on UDP port 2000, gather raw segment data, and relays it to the AWS X-Ray API
- X-Ray Console : reporting app to view service maps and traces for requests that the applications serve.
- X-Ray API: provides access to all X-Ray functionality through the AWS SDK, AWS Command-Line Interface, or directly over HTTPS
- X-Ray SDK : Software Development Kit to interface between end user app client and X-Ray core service, programmatically.
X-Ray Trace Design

A trace is a collection of user requests between the service and the resources available. Developers can use the traces in a service map that shows latency within business apps.
X-Ray SDK Design
X-Ray SDK sends JSON to X-Ray daemon process listening for UDP traffic. The daemon buffers segments in a queue and uploads them to X-Ray in batches.

X-Ray SDK provides:
- Interceptors to add to your code to trace incoming HTTP requests.
- Client handlers to instrument AWS SDK clients that your application uses to call other AWS services.
- An HTTP client to use to instrument calls to other internal and external HTTP web services.
.NET Core Implementation
As a developer, it is easy to integrate X-Ray within .NET Core applications.
HttpClientXRayTracingHandler implements HttpClientHandler, which can be leveraged in conjunction with these typed clients. After registering the HttpClientXRayTracingHandler, a handler is marked with the given typed client as follows:
services.AddTransient<HttpClientXRayTracingHandler>();
services.AddHttpClient<ICustomGitHubClient, CustomGitHubClient>()
.AddHttpMessageHandler<HttpClientXRayTracingHandler>();
Also, it is essential to write few configuration files in .NET Core project for the complete development.
// Initializing Configuration object with X-Ray recorder
AWSXRayRecorder.InitializeInstance(configuration: Configuration);
// All AWS SDK requests will be traced
AWSSDKHandler.RegisterXRayForAllServices();

//In your configure method
app.UseXRay(“XRayServerless”);

//In your appsettings.json:
/*
“XRay”: {
“DisableXRayTracing”: “false”,
“UseRuntimeErrors”: “true”
}
*/
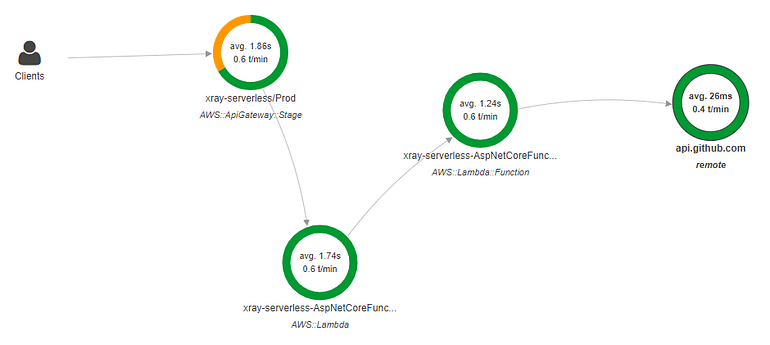
After the proper configuration and integration coding, X-Ray displays the traces for the actual HTTP calls as below:

The above trace table data is easily transformed into ServiceMap in X-Ray Console App

A developer can retrieve trace data 30 seconds after the successful persistence and that data is valid to view for 30 days.
Closing Note
X-Ray is leveraged as performance management tool to analyze and debug applications. As part of the application level instrumentation, the latency details are showcased at every integration point of the software. It assists us to troubleshoot the root cause of any system issues in the complex modern enterprise application.
Share this article:
